A live 3D map of global seismicity, built on the one thing flat quake maps throw away: how far underground the rupture actually happened.
Project
Earthquake Depth Map, self-initiated
Role
Concept, interaction design, data visualisation, front-end development
Year
2026
Built with
Three.js / WebGL
Live USGS + EMSC feeds
NOAA & NASA volcano data
8 languages
Web, macOS, Windows, Android
Open It Anywhere
The same map in the browser and as an app. Real earthquakes, refreshed live. Drag to rotate, scroll to zoom, hover a marker for the details.
macOS
A native window for Apple Silicon Macs (M1 and later), macOS 11 or newer. Updates itself when a new version is out.
Download for MacAndroid
The full map as an app on Android phones and tablets (Android 7.0 or newer). Google Play listing on the way.
Download for AndroidWindows
A native desktop app for 64-bit Windows 10 and 11. Installs without admin rights and updates itself when a new version is out.
Download for WindowsThe Problem:
Every Quake Map Is Flat
An earthquake is not a dot on a coastline. It is a rupture at a specific point underground, and that point can be five kilometres down or six hundred. Depth is what separates a shallow quake that levels a town from a deep one nobody feels, and it is the first thing a flat map deletes. Every dot lands on the surface, and the most important number in the dataset becomes a footnote in a tooltip.
Depth as the Main Axis
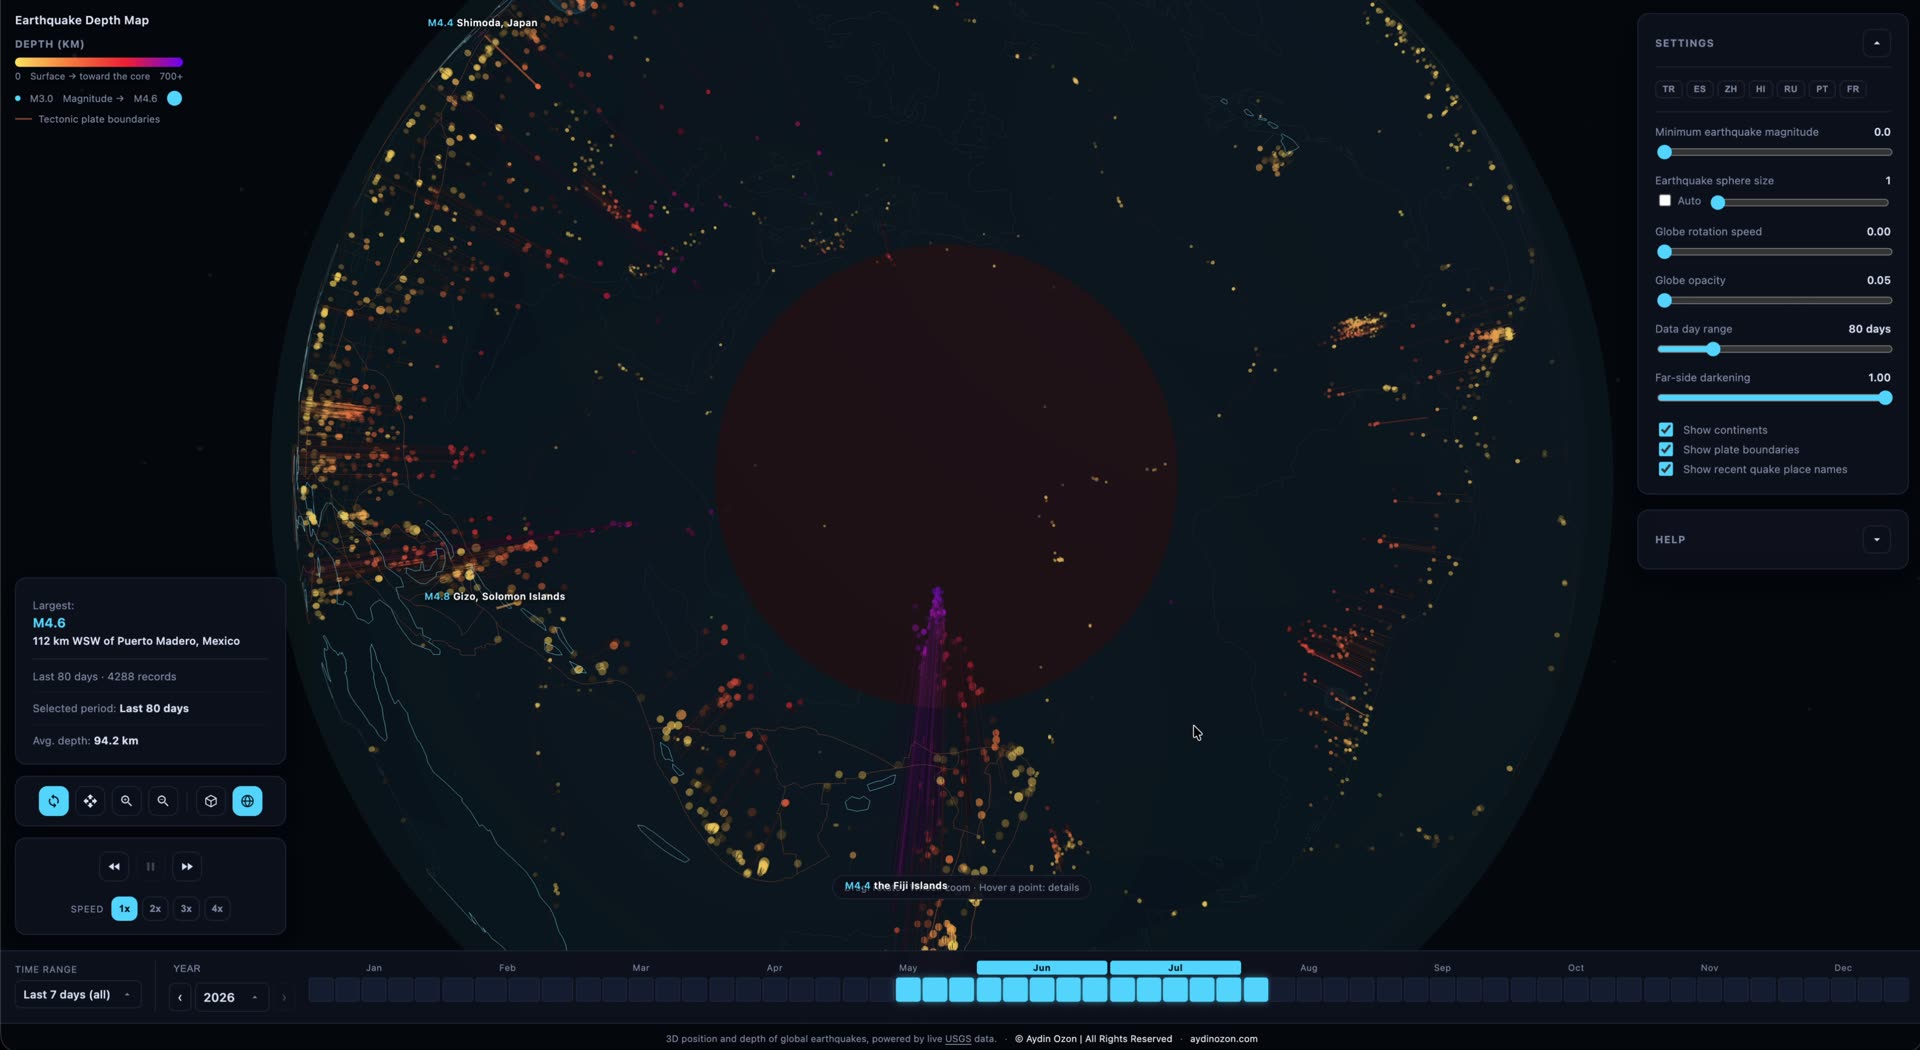
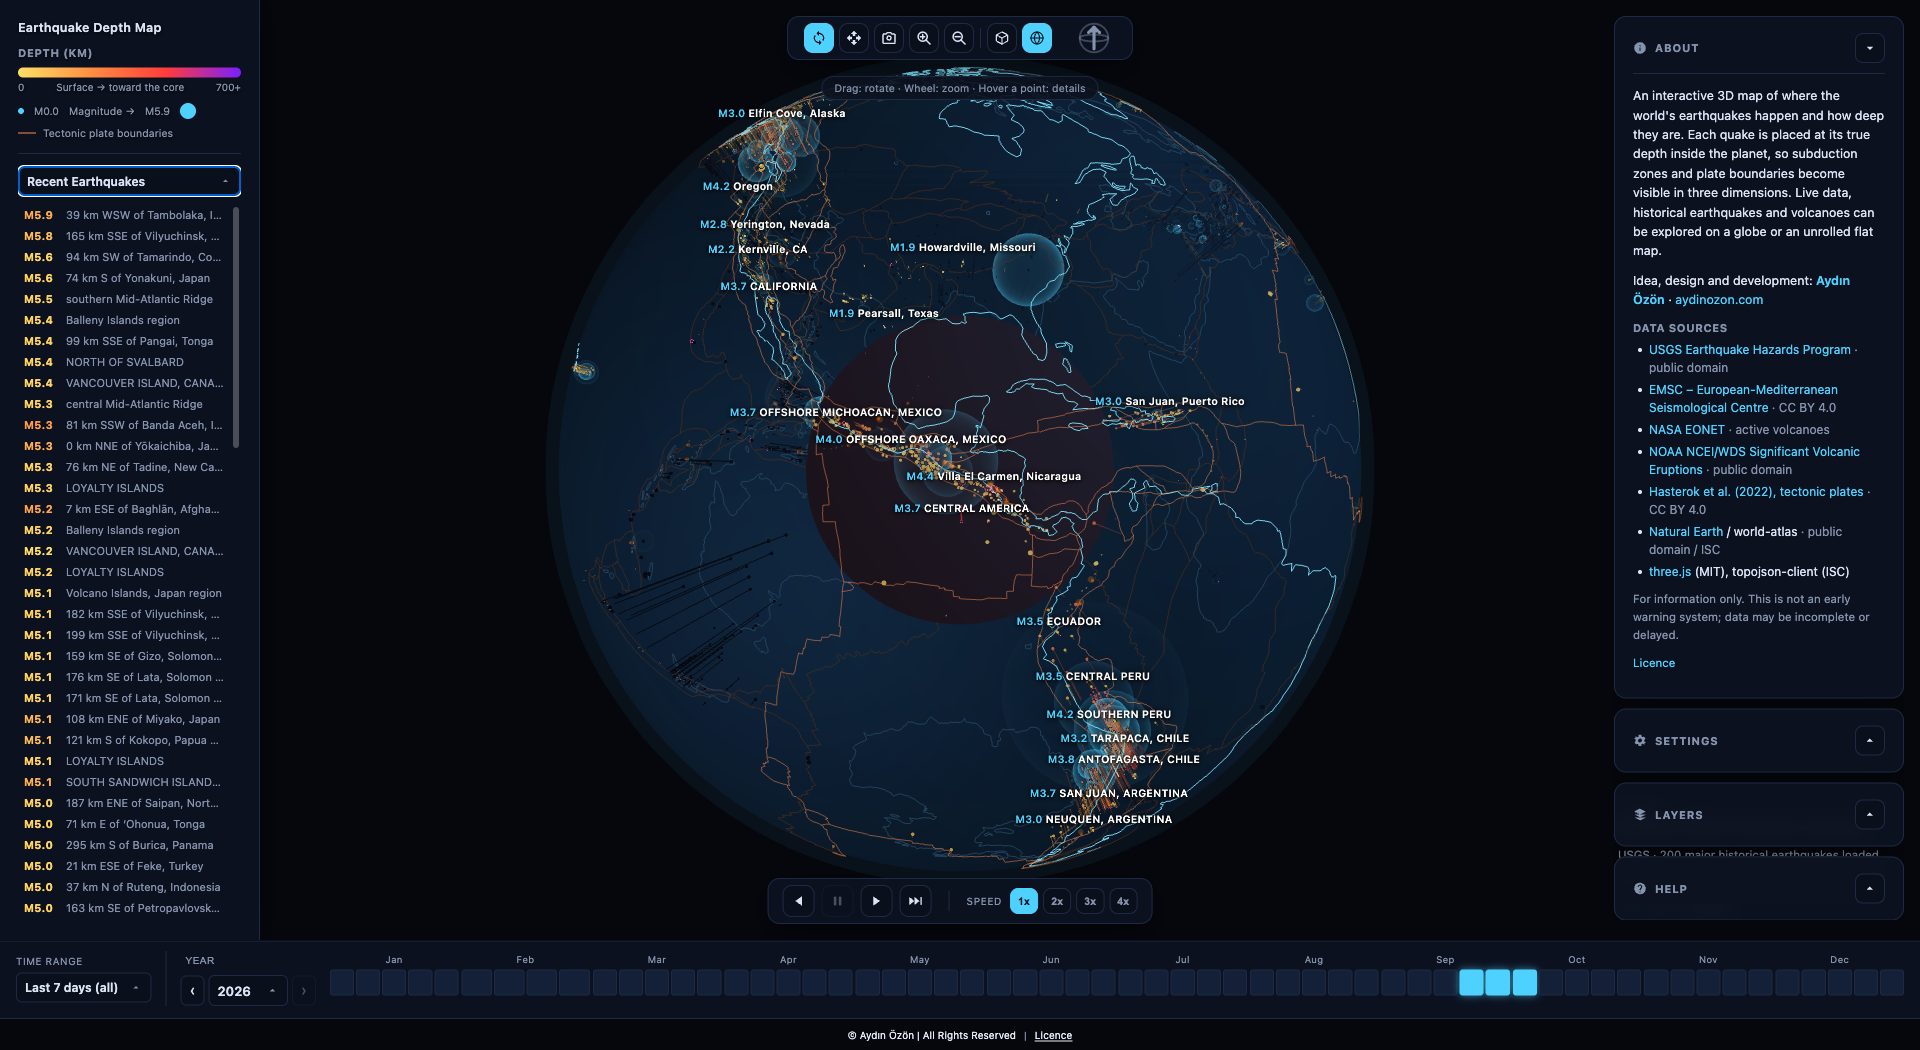
Every event is placed at its true hypocentre inside the sphere and connected to the ground above it by a line as long as it is deep. Colour runs the same axis, yellow at the surface through orange and red into violet at 700 km, so a subduction zone stops being a smear of dots and becomes what it actually is: a slab of colour diving under a continent at an angle you can read off the screen.
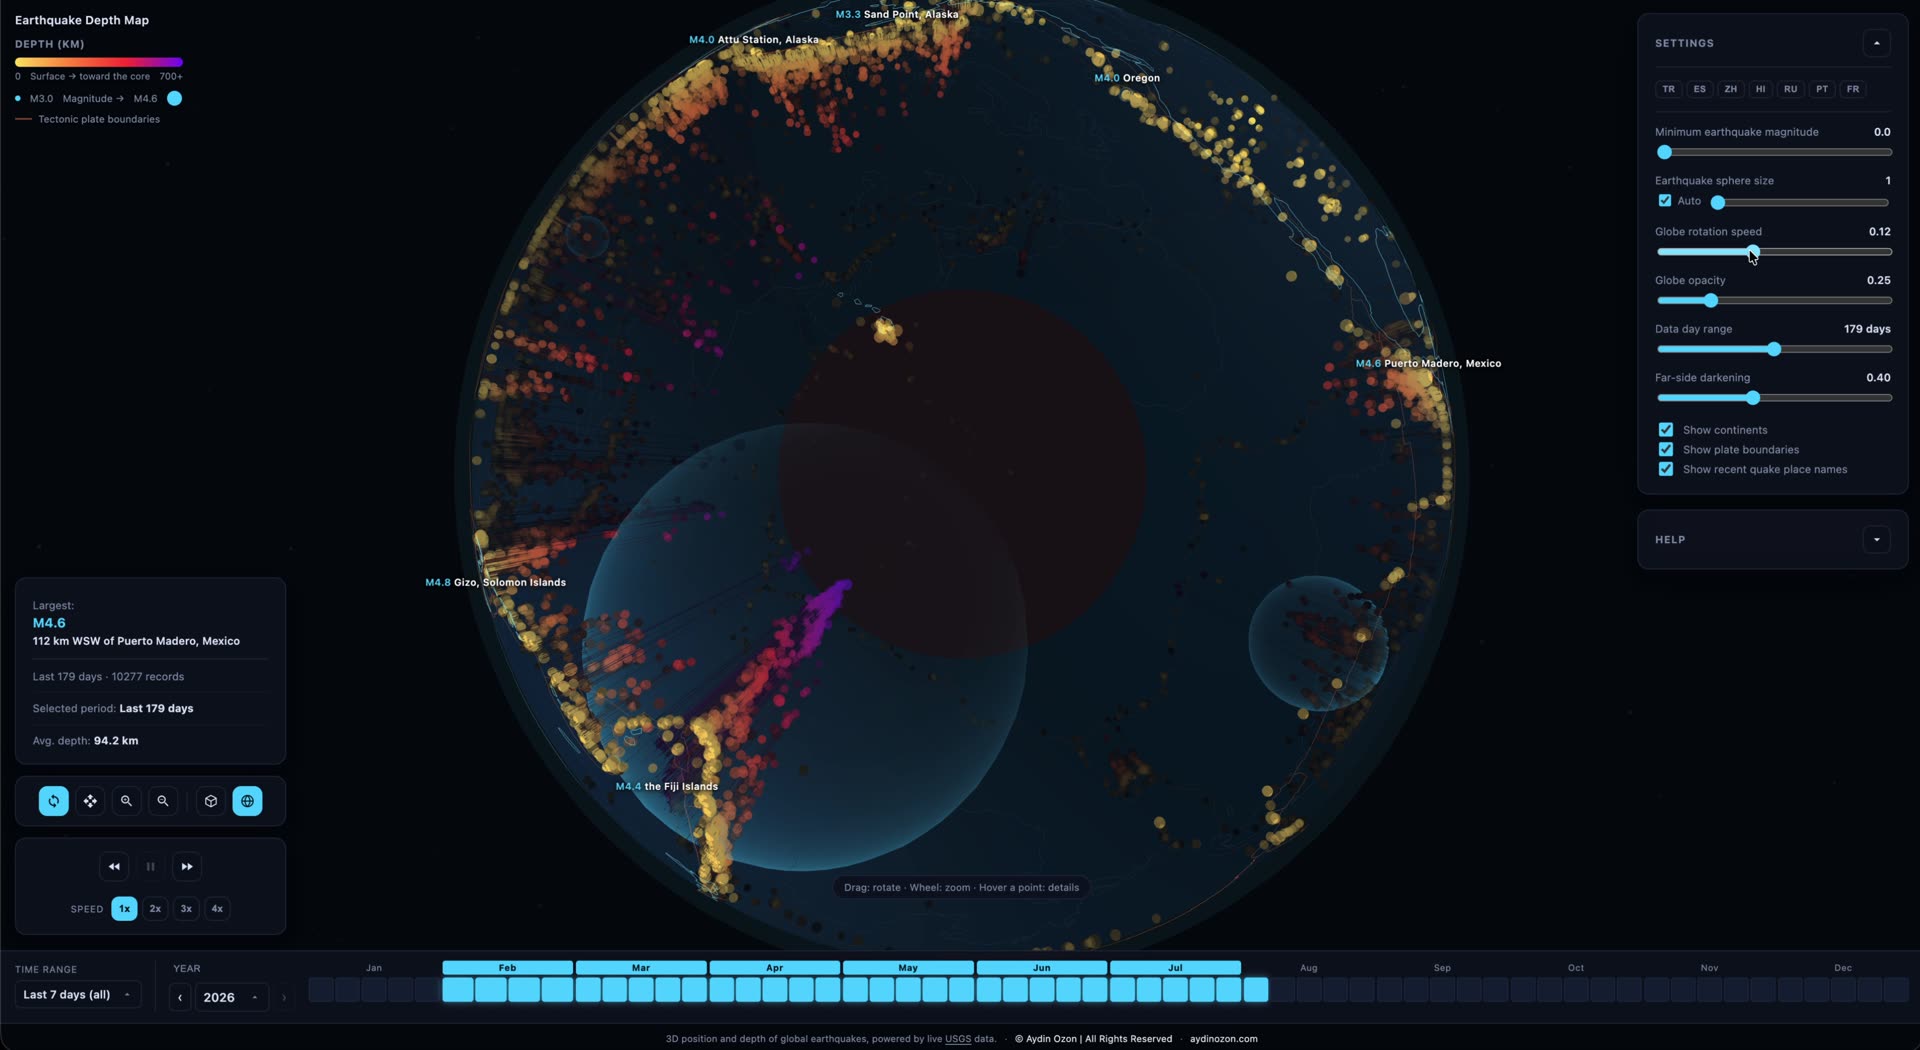
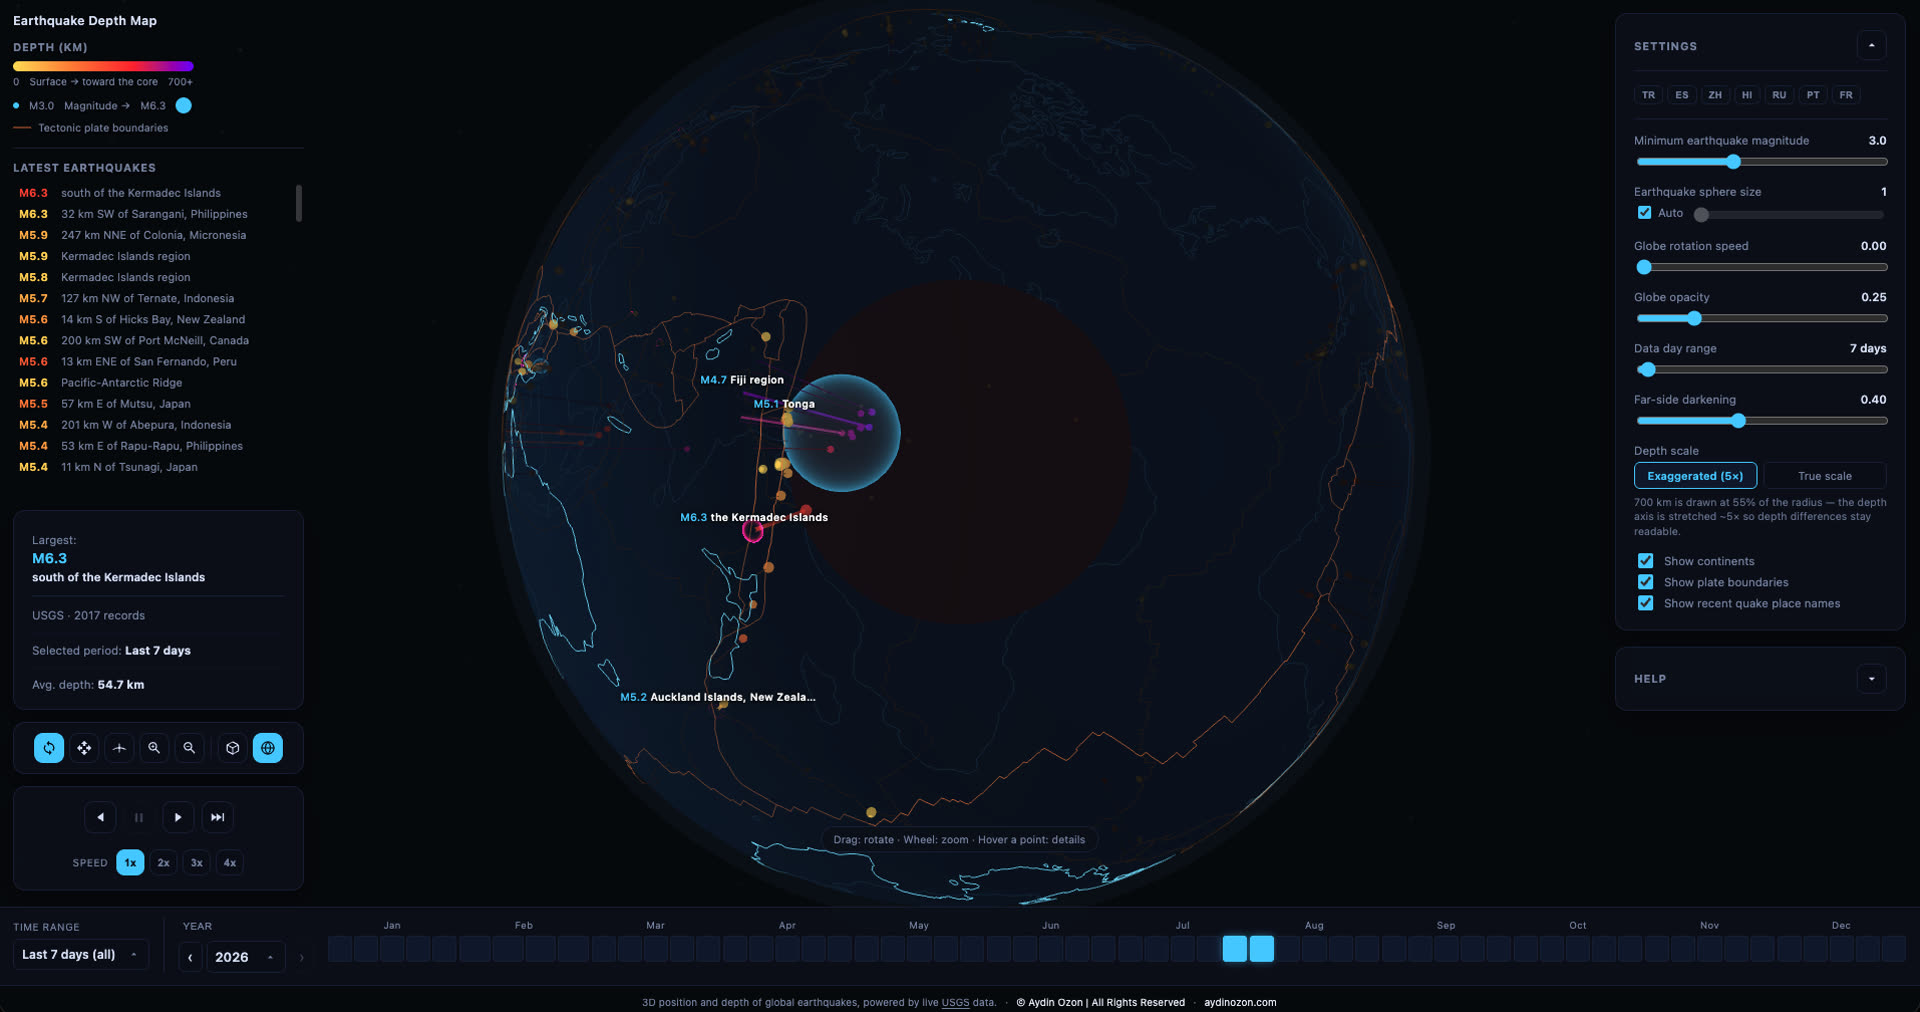
The Last 24 Hours, Pulsing
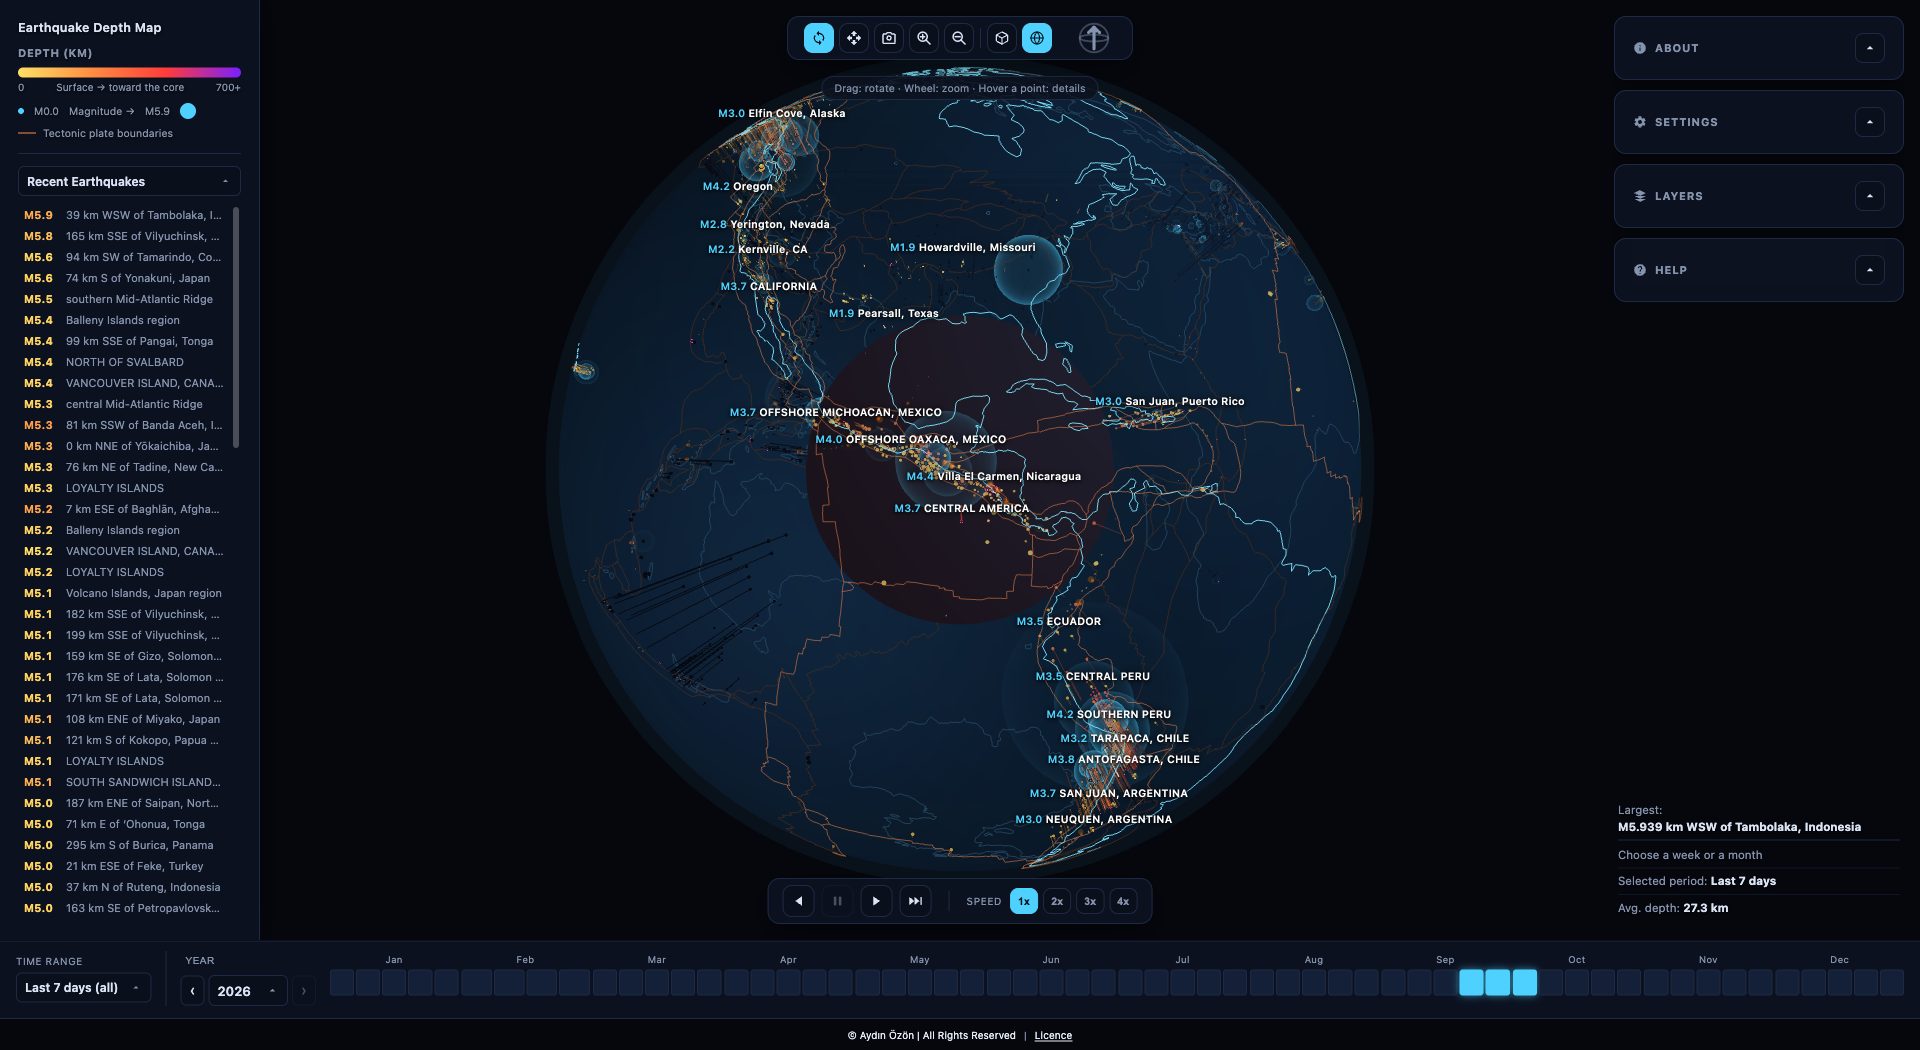
Fresh events announce themselves as a chain. The hypocentre flashes, a blue shell expands in 3D from that point, and the moment the shell reaches the ground a red ring is born and spreads across the surface. Deep quakes keep their shell travelling and leave a small mark on top; shallow ones ring out at once. Beside the globe, a list of those same events, strongest first, so nothing important can hide on the far side of the planet.
Point-Anchored View
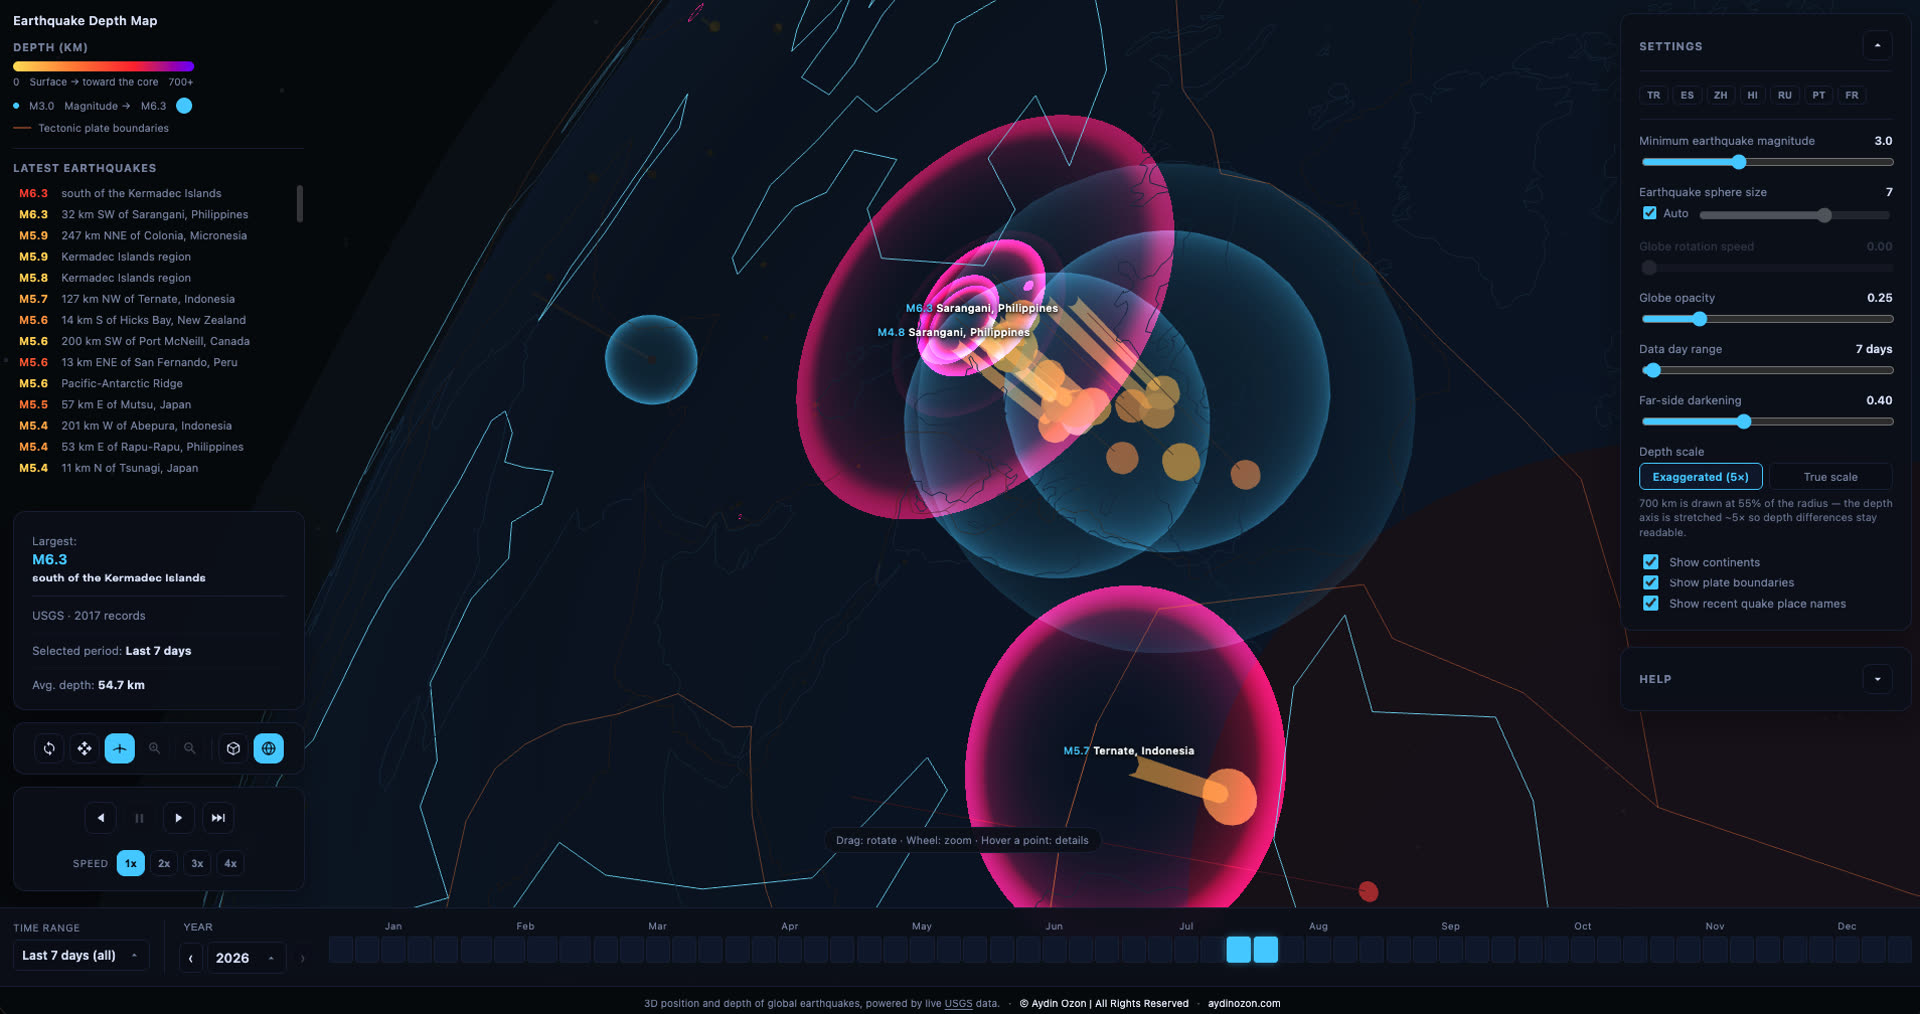
Click a spot on the surface and the camera flies in and looks down at 45°. From then on every drag circles that point like a bird instead of orbiting the planet's centre. The angle is not a taste decision: it is what keeps the ground and the depth columns hanging beneath it in the same frame. Keep dragging downward and you pass under the surface, which is where a subduction zone stops being a diagram and starts being a shape.
Volcanoes on the Same Faults
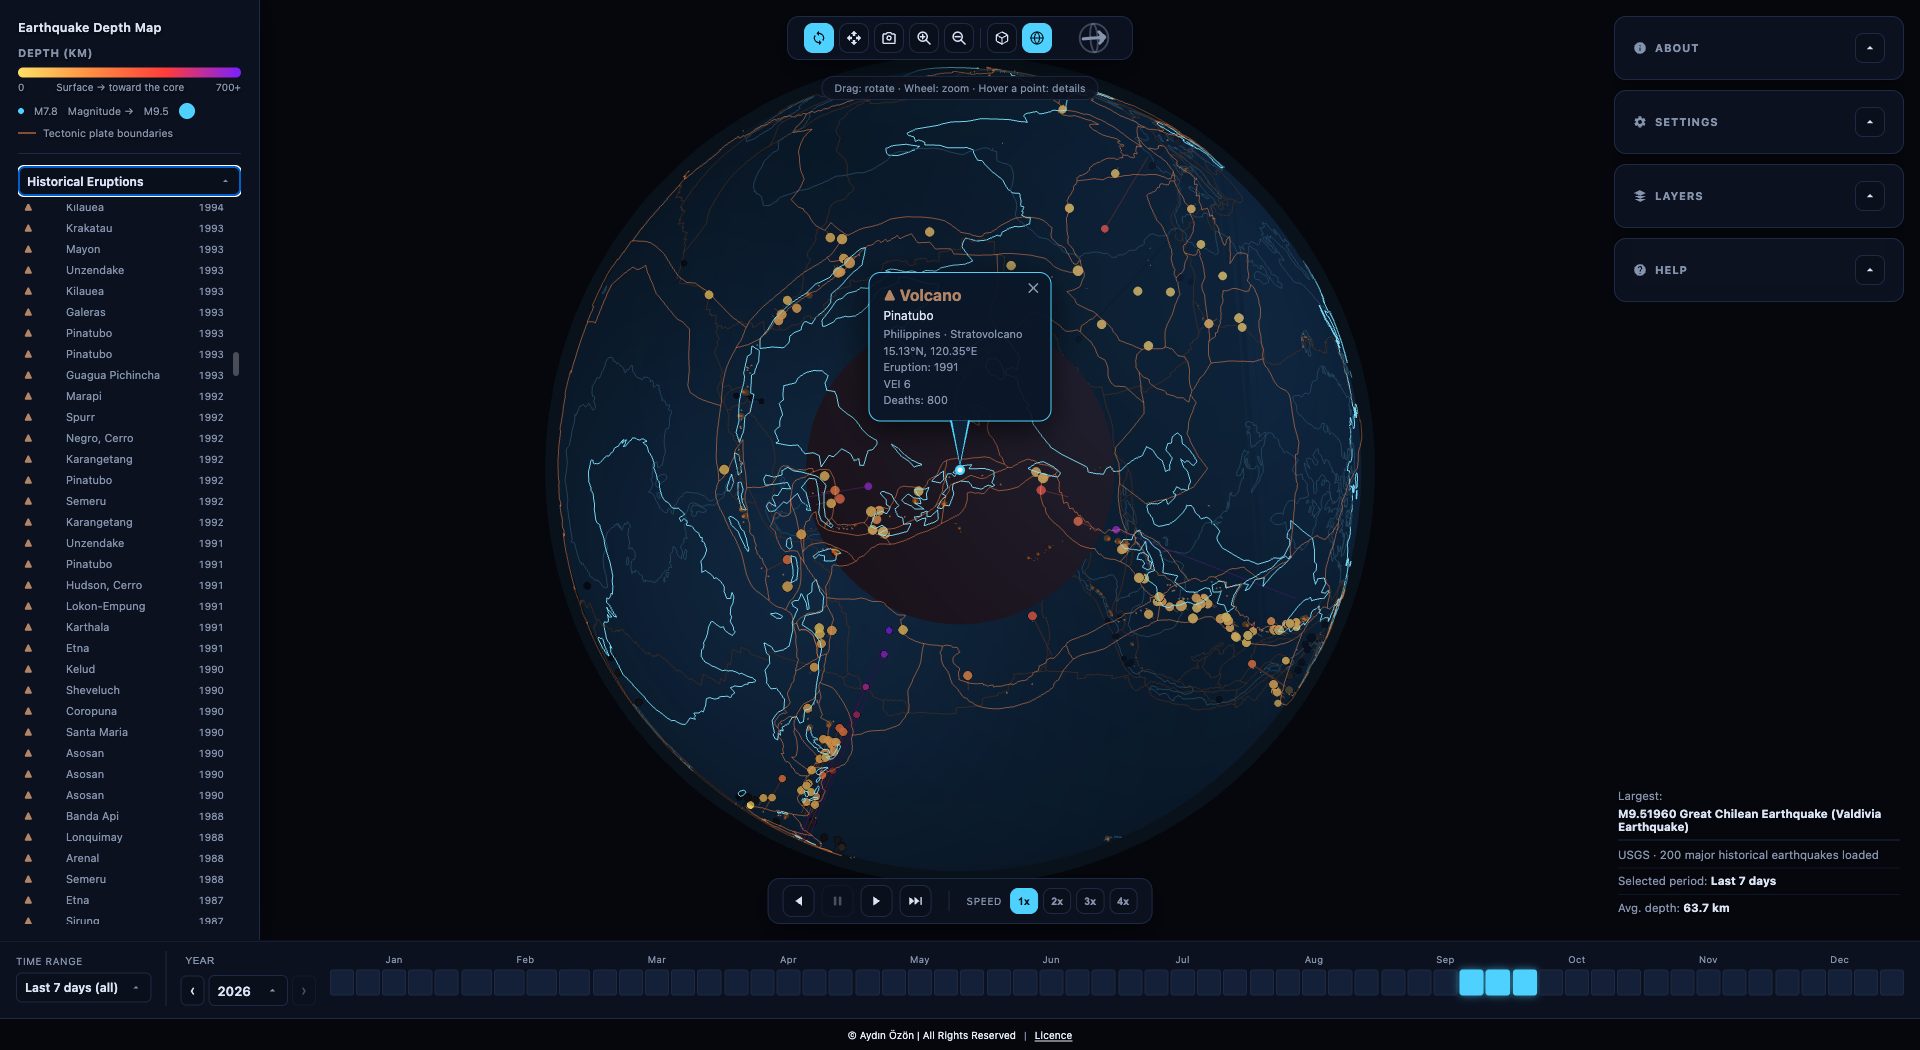
Earthquakes and volcanoes trace the same plate boundaries, so they share the globe. Volcanoes erupting right now come in live from NASA EONET. Behind them sit more than 800 significant eruptions from the NOAA record, each with its year, its explosivity (VEI) and its human cost. Pick one from the list and the planet turns to it.
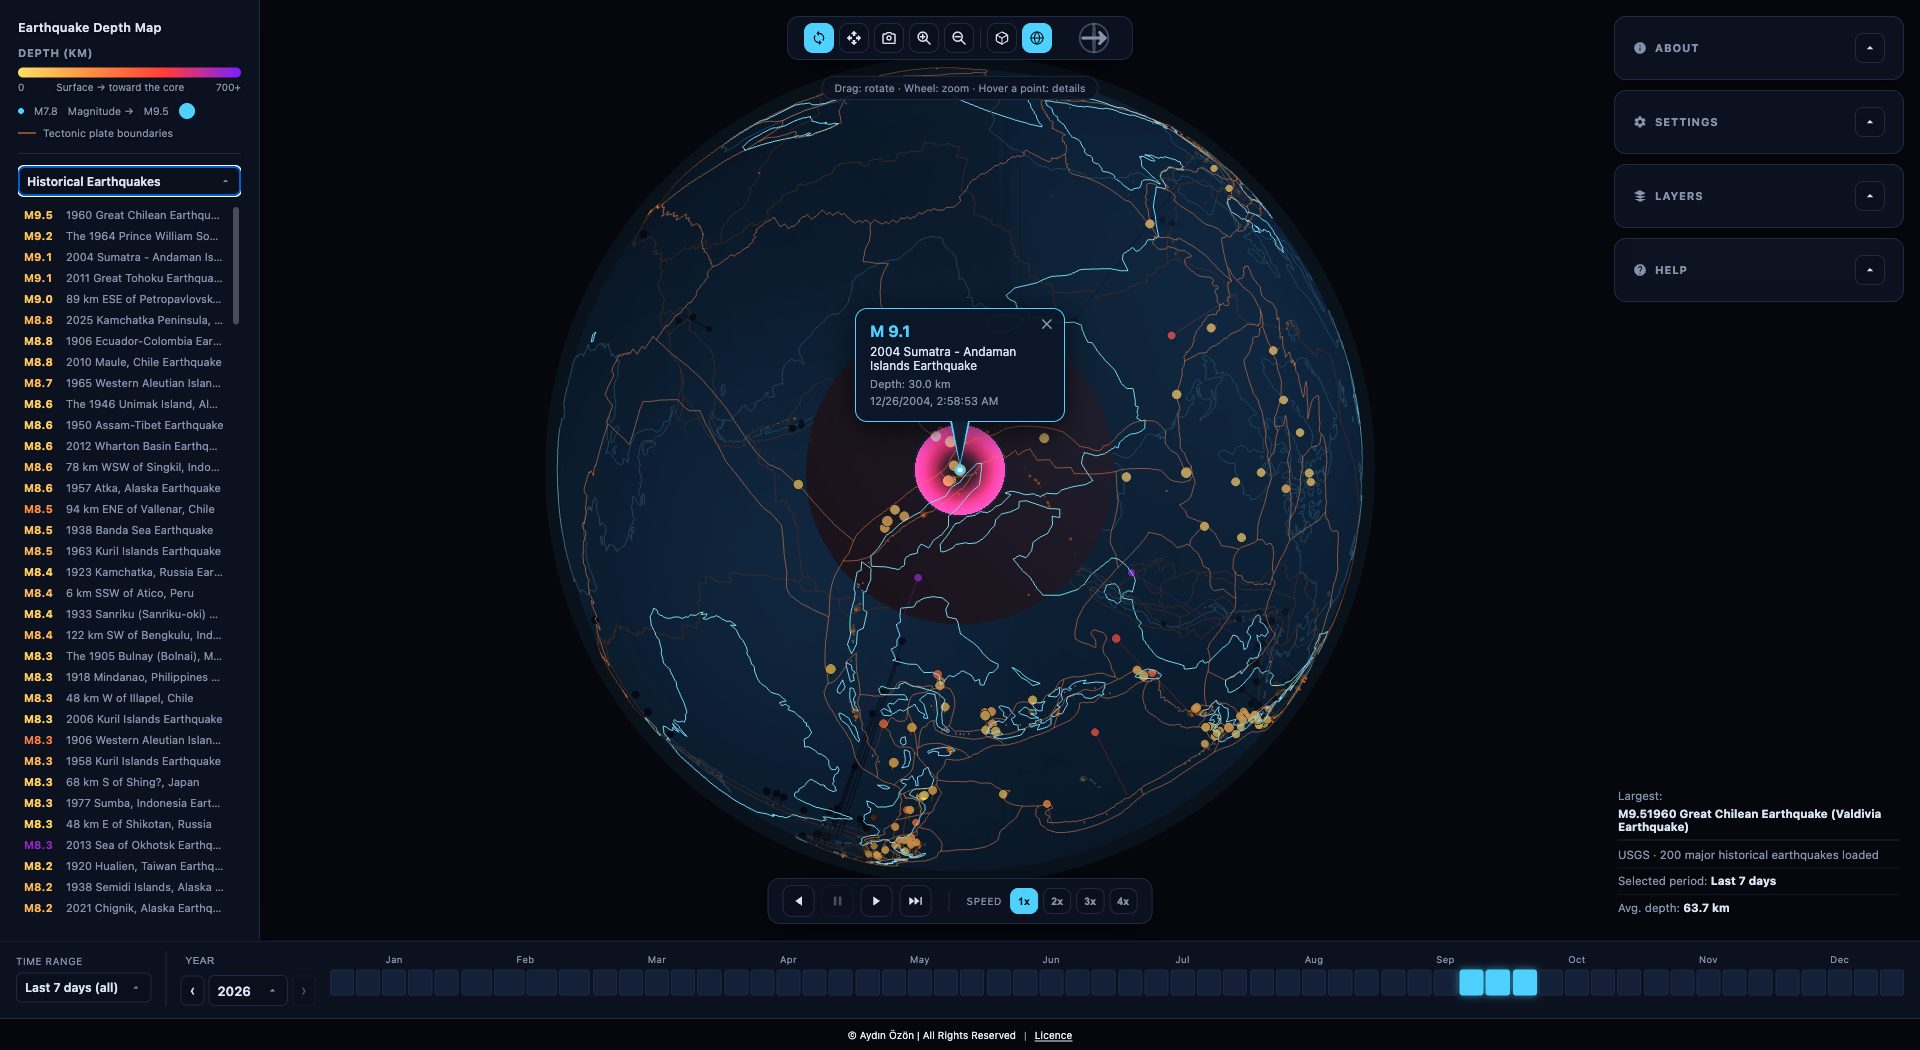
A Century of Great Quakes
The live feed shows this week; history shows the scale. Two hundred of the largest earthquakes since 1900 are built in, from Valdivia 1960 to Tohoku 2011, each placed at its true depth. Live events come from two networks, USGS worldwide and EMSC for Europe and the Mediterranean, merged so a small local quake is not lost.
Unrolling the Planet
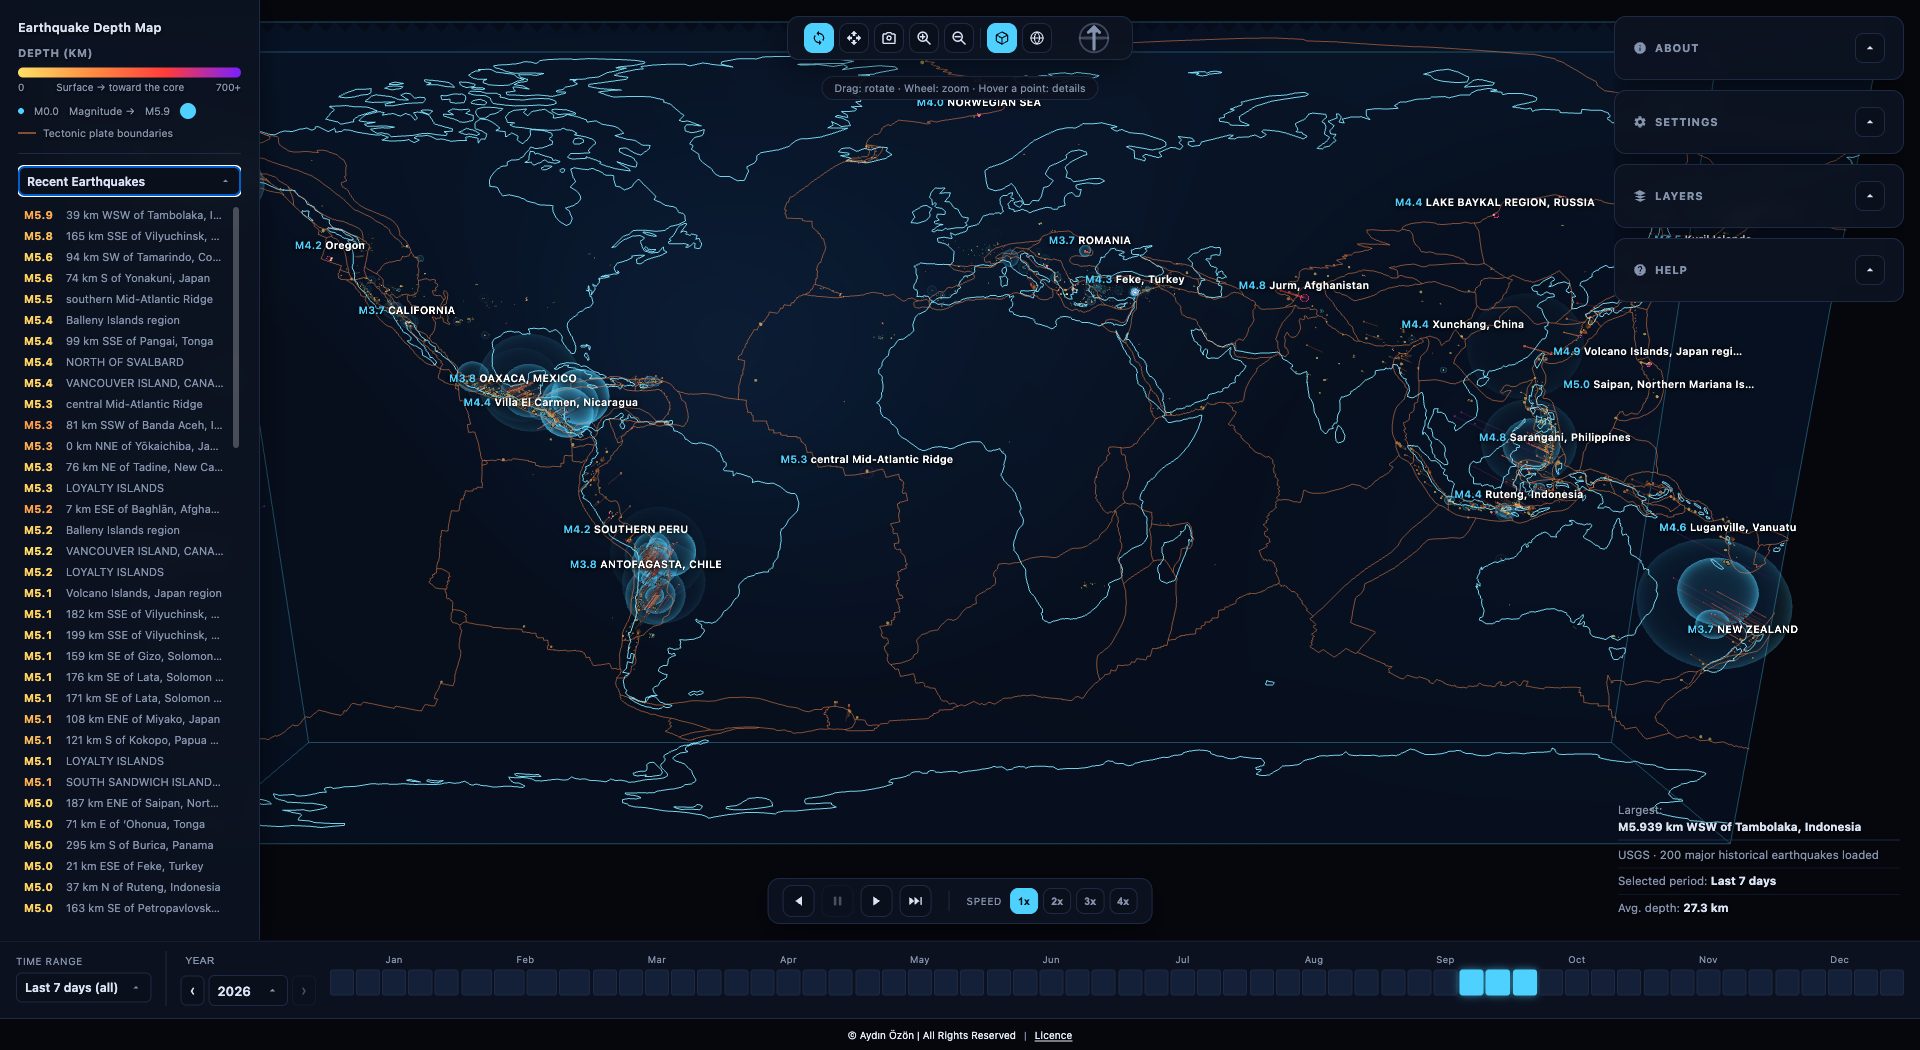
A globe is honest but it hides half of itself. So the sphere can be morphed, continuously, into a flat slab: latitude and longitude spread out into a rectangle while depth stays a real third dimension going back into the block. Nothing teleports, every point travels between its two positions, and watching the transition is the fastest way to understand that the columns under the map were there the whole time. The same morph carries the coastlines, the plate boundaries, the depth lines and the pulses with it.
Time Is a Control,
Not a Filter
Under the map sits a full calendar: a year, its months, its weeks, any single day back through the USGS archive. Press play and the days advance one at a time, each one leaving a fading trail of the days before it, so a swarm builds and drains in front of you instead of arriving as a single static cloud. Every day that has been fetched stays in memory, so scrubbing back over it is instant.
Go and Turn the Planet
Launch the mapEarthquakes: U.S. Geological Survey and EMSC. Volcanoes: NOAA NCEI and NASA EONET. Plate boundaries: Hasterok et al. (2022).
For information only, not an early warning system. Get the app